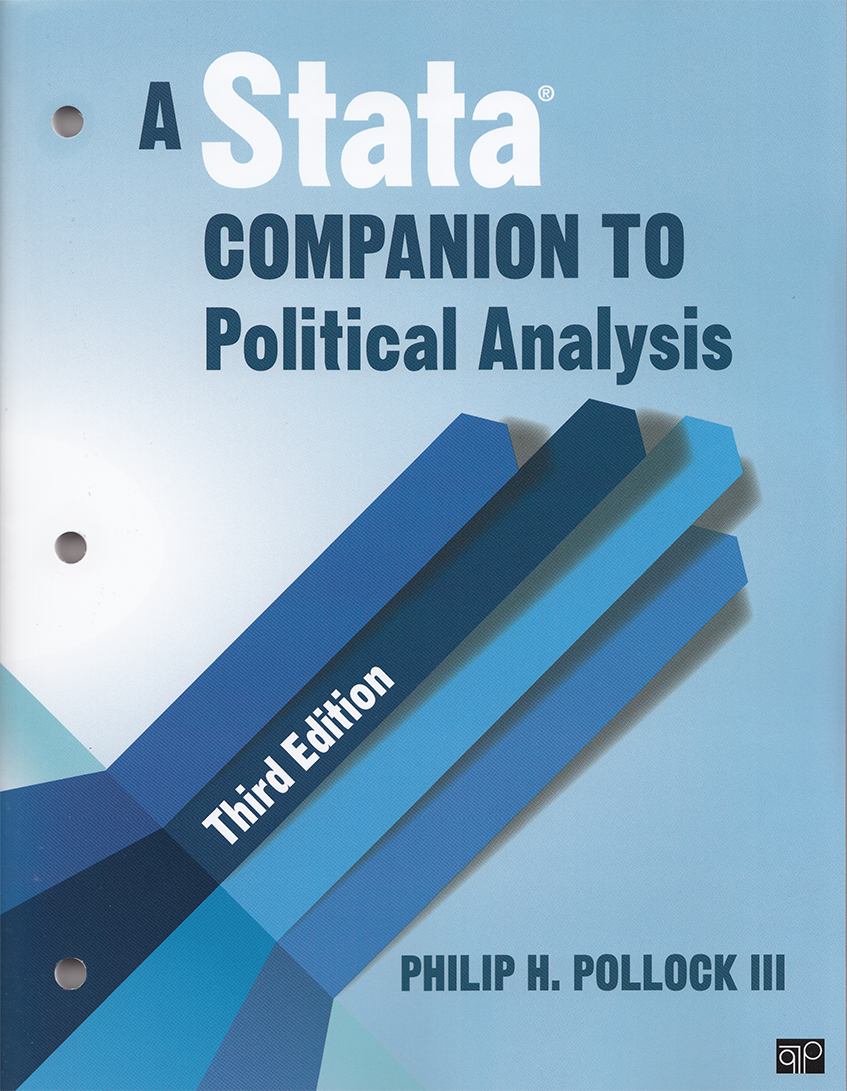
A Stata Companion to Political Analysis, Third Edtition
by Philip H. Pollock III
 The
third edition of Philip Pollock’s A Stata Companion to Political
Analysis is an excellent guide, whether you are taking your first
political-science course or teaching one. The new edition was written
using Stata 13, but the datasets can be read with Stata 11 through 13.
Like the previous editions, the book maintains the same instructional
insights and focus on how to present results effectively. The
third edition of Philip Pollock’s A Stata Companion to Political
Analysis is an excellent guide, whether you are taking your first
political-science course or teaching one. The new edition was written
using Stata 13, but the datasets can be read with Stata 11 through 13.
Like the previous editions, the book maintains the same instructional
insights and focus on how to present results effectively.
Each chapter is a tutorial with a rich set of exercises. The book
surveys the statistical methods that professional political scientists
use; the treatment of research methods deftly incorporates data
management, graphical analysis, and statistics into the
political-science domain. In this edition, the author emphasizes the
use of do-files as a unified way of working with Stata. Also, the
author complements the content of the previous edition by illustrating
the benefits of the margins and marginsplot commands as tools to use
and interpret results after estimation. He also discusses the topic of
weighted and unweighted data. The thorough examples show how to
complete each task with Stata while giving firsthand experience in
political research.
Table of contents Figures
Preface
Introduction: Getting Started
Datasets
1. Introduction to Stata - Information about a Dataset
Information about Variables
Do-Files
Log Files
Printing Results and Copying Output
A CLOSER LOOK: Weighting the gss2012 and nes2012 Datasets
Getting Help
Exercises
Notes
2. Descriptive Statistics
- Interpreting Measures of Central Tendency and Variation
Describing Nominal Variables
Describing Ordinal Variables
Describing Interval Variables
Obtaining Bar Charts and Histograms
Obtaining Case-Level Information with sort and list
Exercises
Notes
3. Transforming Variables
- Transforming Categorical Variables
Transforming Interval Variables
A CLOSER LOOK: The xtile Command
The label define and label values Commands
Creating an Additive Index
Creating Indicator Variables
Exercises
Notes
4. Making Comparisons
Cross-Tabulation Analysis
Mean Comparison Analysis
A CLOSER LOOK: The format Command
Graphing an Interval-Level Dependent Variable
Graphing a Categorical Dependent Variable
A CLOSER LOOK: The replace Command
Strip Charts: Graphs for Small-n Datasets
Exercises
Notes
5. Making Controlled Comparisons
Cross-Tabulation Analysis with a Control Variable
A CLOSER LOOK: The If Qualifier
Bar Charts for Controlled Comparisons with a Categorical Dependent Variable
Mean Comparison Analysis with a Control Variable
An Example of Interaction
An Example of an Additive Relationship
Bar Charts and Box Plots for Controlled Mean Comparisons
Exercises
Notes
6. Making Inferences about Sample Means
- Describing a Sample Mean
Testing the Difference between Two Sample Means
Extending the mean and lincom Commands
Exercises
Notes
7. Chi-square and Measures of Association
- Analyzing Ordinal-Level Relationships
Summary
Analyzing an Ordinal-Level Relationship with a Control Variable
Analyzing Nominal-Level Relationships
Analyzing Unweighted Data with the tabulate Command
Exercises
Notes
8. Correlation and Linear Regression
- The correlate Command and the regress Command
A CLOSER LOOK: R-Squared and Adjusted R-Squared: What's the Difference?
Creating a Scatterplot with a Linear Prediction Line
Multiple Regression
A CLOSER LOOK: Bubble Plots
Correlation and Regression with Weighted Data
Exercises
Notes
9. Dummy Variables and Interaction Effects - Regression with Dummy Variables
A CLOSER LOOK: The test Command
Interaction Effects in Multiple Regression
Graphing Linear Prediction Lines for Interaction Relationships
Exercises
Notes
10. Logistic Regression - The logit Command and the logistic Command
Logistic Regression with Multiple Independent Variables
A CLOSER LOOK: The estimates Command and the lrtest Command
Working with Predicted Probabilities
The margins Command with the atmeans Option
The margins Command with the over Option
MERS-MEMS Hybrids
Exercises
Notes
11. Doing Your Own Political Analysis
- Five Doable Ideas
Political Knowledge
Economic Performance and Election Outcomes
State Courts and Criminal Procedure
Electoral Turnout in Comparative Perspective
Congress
Inputting Data
Stata Formatted Datasets
Microsoft Excel Datasets
Writing It Up
The Research Question
Previous Research
Data, Hypotheses, and Analysis
Conclusions and Implications
Notes
© Copyright StataCorp LP 1996-2015.


|


