| |

Direct Interface

Data Desk's direct
manipulation interface provides "first person" interaction with your
data rather than the "third person" interaction found in most programs.
Instead of giving the computer a command (by typing it or filling in a
dialog screen), you just pick up the appropriate tool or icon and do
the job directly. So, if you want to reposition the points in a plot,
don't tell Data Desk where to plot them verbally, pick them up with the
hand tool and move them. If you want to identify a point, click on it.
If you want to change the color or symbol of a point select it and
click on the desired color or symbol in the palettes. If you want to
rotate points in a rotating plot, push them. If you want a new variable
on the x-axis of a plot, pick up its icon and place it on the axis.
This direct interface lets you act more naturally, which simplifies and
speeds analyses.
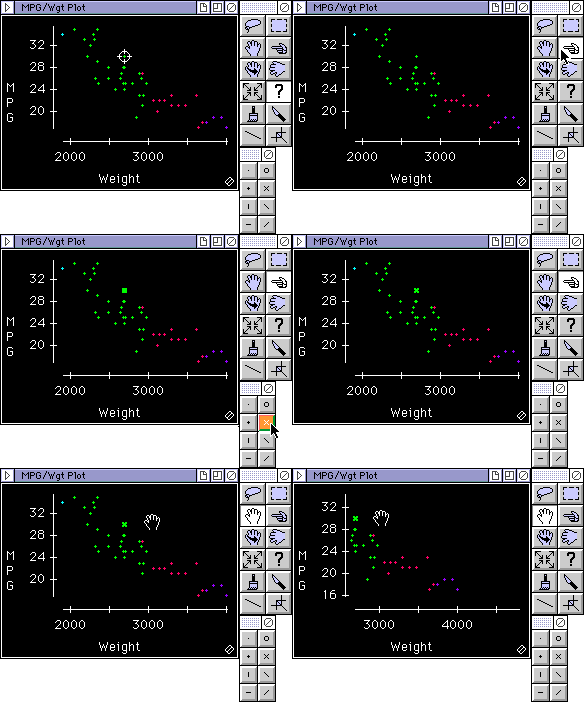
The example above shows
the Query identifying a point, the Pointer tool selecting that point, a
click in the symbols palette to change the display symbol, and the Hand
tool repositioning the points to make it easier to see the point's
y-axis value.
©2015, Data Description, Inc.


|
|


