| |
 by Interactive Learning Europe by Interactive Learning Europe
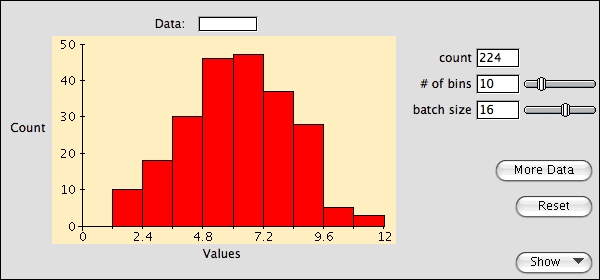
Histograms The histogram Teaching
Applet demonstrates the drawing of a histogram to display data.
Adjusting the number of bins shows vividly how much the apparent shape
of the histogram depends on its scale.
©2010, Data Description, Inc.


|
|