|
|


|
|
|
|
MapViewer 8
|
| |
 
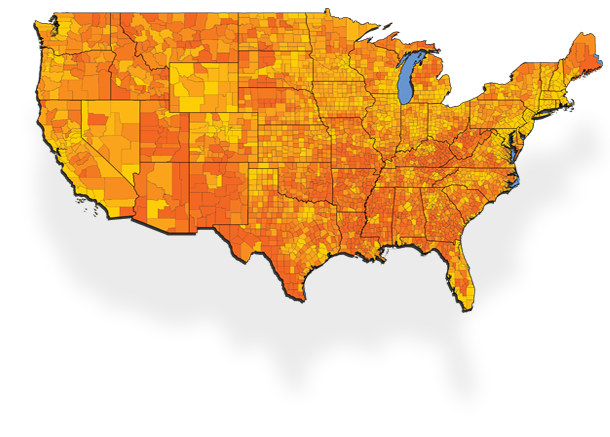
Product Description
MapViewer is an
affordable mapping and spatial analysis tool that allows you to easily
produce publication-quality thematic maps. Precisely display your data
distribution with the most intuitive functions and features. Your data
is unique and you need the best mapping software for the job!
Create one of 15 different 2D and 3D map types including: contour,
density, prism, flow, territory, vector, gradient and many more!
Visually display your information for a better understanding of data
Customize maps to create or define sales, insurance, and marketing territories
Use customized maps to outline marketing strategies
Use maps to compare data to track trends
Effectively display distribution of any geographically distributed data
Create a variety of presentation quality images to geographically display information
Features:
- Base Maps
- Pin Maps
- Hatch Maps
- Contour Maps
- Symbol Maps
- Density Maps
- Territory Maps
- Vector Maps
- Line Graph Maps
- Gradient Maps
- Bar Maps
- Flow Maps
- Prism Maps
- Pie Maps
- Cartogram Maps
- Multi-Graph Maps
- Map Layers
- Customize Your Map
- Managers
- Map Projections
- Automation
- Boundary and Data Files
- Worksheet
- Supported File Formats
- Additional Features
What's new in Version 8
We
have compiled a list of some of the top new features in MapViewer 8.
This list is only a small sampling of the new features added to
MapViewer 8.
- New and Improved User-Interface
- Create Multi-Graph Maps
- Create Bivariate Symbol Maps
- Create Contiguous Cartogram Maps
- Create Proportional Pin Maps
- Download Online Maps
- Query Across Multiple Layers
- Use Text Columns for Territory Map Territories or Hatch Map Classes
- Increased Customization of Data Labels
- Unlimited Attribute Support
- Embed Data in GSM Files
- Improved Coordinate System Dialog
- Font/Format Support for Legend Entries
- New Import/Export Formats
- New Coordinate Systems, Datums, and Projections
- Additional (64-bit, Unicode, New Text Editor Dialog, Object Transparency)
System Requirements:
- Windows XP SP2, Vista, 7, 8 (excluding RT), or higher
- 32-bit and 64-bit supported
- 1024 X 768 or higher monitor resolution with 16-bit (or higher) color depth
- At least 500 MB free hard disk space
- At least 512 MB RAM minimum, 1GB RAM recommended
Copyright © 2015 Golden Software Inc.
|
|
|
|