CLASSIC COMPARISONS
- Means (t-tests)
- Proportions
- Variances
- Correlations
- McNemar’s test
- Clustered data
ANOVA
- One-way models
- Two-way models
- Repeated-measures models
LINEAR REGRESSION
- Slope test
- Coefficient-of-determination test
- Partial-correlation test
CONTINGENCY TABLES
- Cochran—Mantel—Haenszel test
- Matched case—control studies
- Cochran—Armitage trend test
CLUSTER RANDOMIZED DESIGNS
- One-sample mean
- Two-sample means
- One-sample proportion
- Two-sample proportions
- Log-rank test
SURVIVAL ANALYSIS
- Log-rank test of survival functions
- Cox proportional hazards model
- Exponential regression
- Clustered data
SOLVE FOR
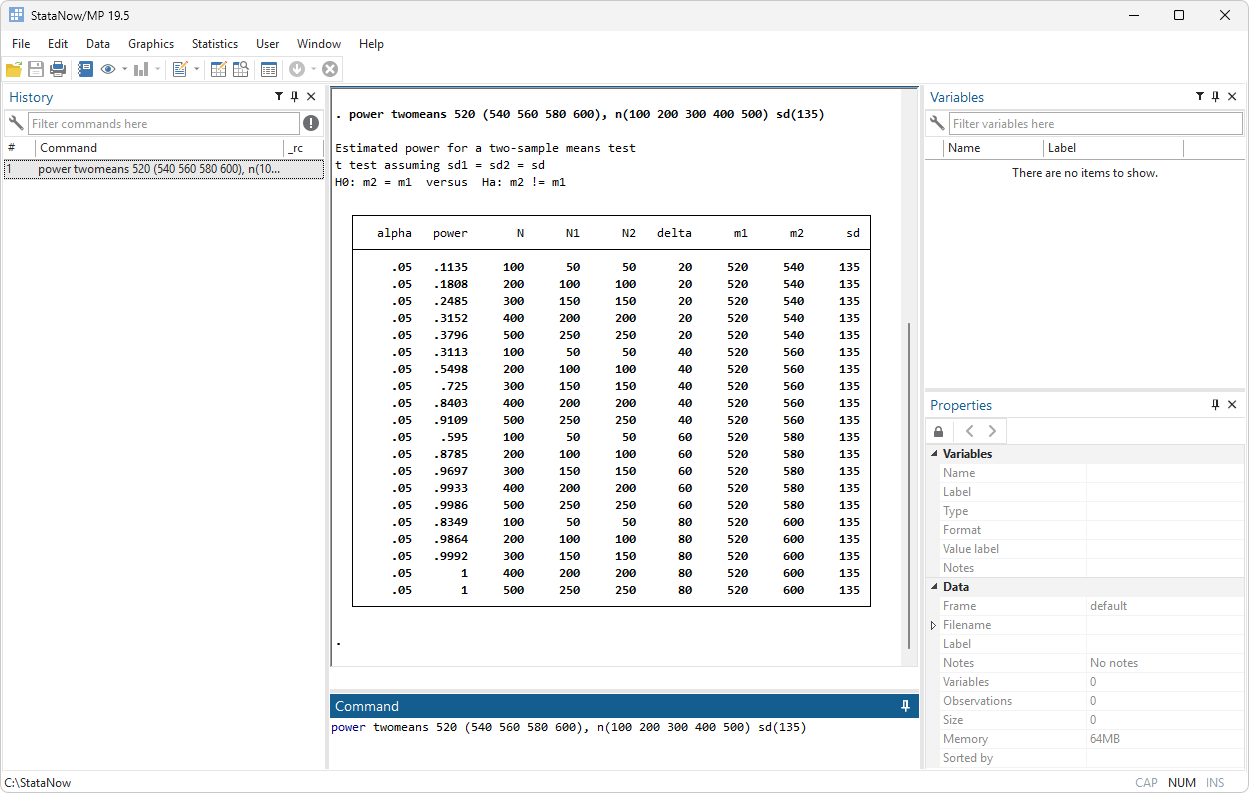
- Power
- Sample size
- Number of clusters
- Cluster size
- Effect size (minimum detectable effect)
SPECIFY LISTS OF
- Alpha values
- Power levels
- Beta values
- Sample sizes
- Ratios of sample sizes
- And more
© Copyright 1996–2025 StataCorp LLC. All rights reserved.
MULTIPLE SCENARIOS USING
- All combinations of values
- Parallel lists of values
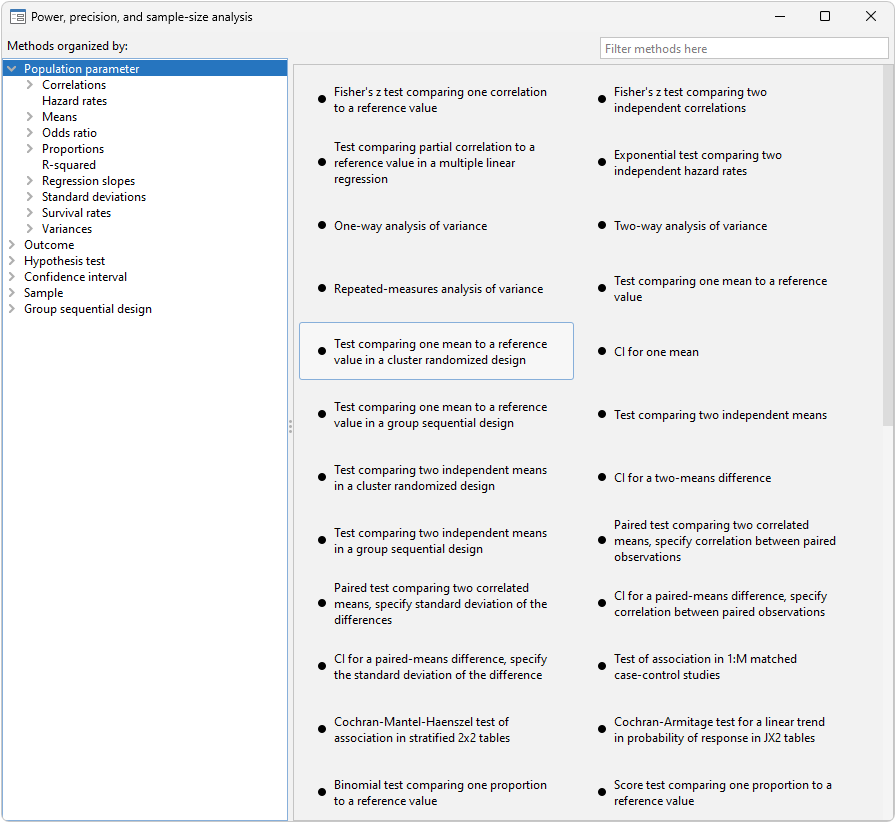
CONTROL PANEL INTERFACE
- Select analysis type from descriptive summaries
- Specify list of power, sample size, or other levels
- Automated tables and graphs
- Customize tables and graphs
- Command interface too (of course)
DESIGNS
- Matched case–control studies
- Cohort studies
- Cross-sectional studies
- Balanced
- Unbalanced
- Cluster randomized designs
TABLES
- Automated
- Customized
GRAPHS
- Automated
- Customized
- Simple or comparative
Also see precision and sample-size analysis for confidence intervals and group sequential designs.


