TRULY REPRODUCIBLE REPORTING
Stata’s commands for report generation allow you to create complete Word®, Excel®, PDF, and HTML documents that include formatted text, as well as summary statistics, regression results, and graphs produced by Stata.
Stata’s commands for creating reports come in two varieties:
Dynamic document commands
These commands create text files, HTML files, and Word documents that incorporate the full output from Stata commands. You can use the Markdown text-formatting language to customize the look of your report.
put* commands — putdocx, putpdf, and putexcel
These commands create Word documents, PDFs, and Excel files that insert results from Stata commands into formatted text and tables in your document.
We will illustrate the differences in these commands below.
Whether you choose the dynamic document commands or the put* commands, you can create documents that are
Reproducible
Stata makes reproducible research easy. For instance, use the version 16 command, and any commands you run today will produce the same results 10, 20, or more years from now. With the datasignature command, you can verify that your data have not changed. By incorporating these tools for reproducibility into the do-files or text files that create your reports, those reports are also reproducible. Rerun your commands at any time and re-create your report.
Dynamic
Perhaps you need to run the same report monthly, updating the results based on new data. Simply rerun the commands that created the report with the updated dataset. All Stata results in the report are updated automatically.
In Stata 16, we have made it even easier for you to generate your reports. Specifically, we have added the following:
The dyndoc and markdown commands now create Word documents in addition to the HTML documents they previously created. Now you can easily incorporate full Stata output and graphs with Markdown-formatted text to create customized Word documents.
The Do-file Editor now provides syntax highlighting for Markdown language elements.
The putdocx command now lets you include headers, footers, and page numbers. It also makes it easier to write large blocks of text.
The html2docx command converts HTML documents, including CSS, to Word documents.
The docx2pdf command converts Word documents to PDFs.
What’s more, all of Stata’s new and previously existing reporting features are now documented in a new Stata Reporting Reference Manual. The manual includes many new examples that demonstrate workflows and provide guidance on customizing the Word, PDF, Excel, and HTML documents you create using Stata.
Let’s see it work
To see how easy it is to create reports, we will show each of the commands in action and demonstrate new features along the way.
Dynamic document commands
Creating HTML documents
Creating Word documents
Change the CSS to change the style
The put* commands
Creating Word documents
Creating PDFs
Creating Excel files
Dynamic document commands
To create a report with one of the dynamic document commands, we first write a text file that includes Stata code and the text to be written in the document.
We use dynamic tags to process Stata code and embed the resulting Stata output in a text file, HTML file, or Word document. We can modify the output by using attributes with the dynamic tags. For example, we can embed the Stata output while suppressing the command. When we combine these dynamic tags with Markdown-formatted text, we can create nicely formatted reports in HTML or Word.
Creating HTML documents
To demonstrate, we create a report on high blood pressure in which we include output from a logistic regression and a graph of the expected probabilities created with marginsplot. Below is our text file with Stata dynamic tags that look something like <<dd …>> and Markdown-formatted text.
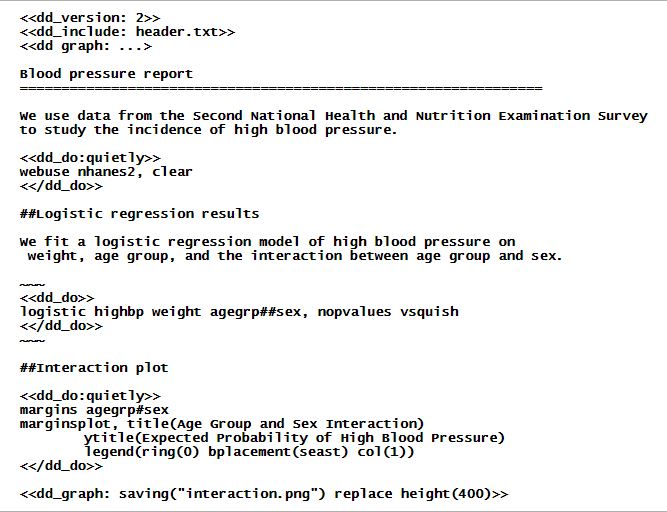
At the top of the text file, we specified the minimum version required to convert the text file. We also included the header.txt file, which contains HTML code used to format the document.
We used equal signs (===) to denote the title of the report and a double pound sign (##) for the section headings. Additionally, we used the <<dd_do>>dynamic tag for Stata commands that we want to execute, but we specified the quietly attribute to suppress the output from webuse and margins.
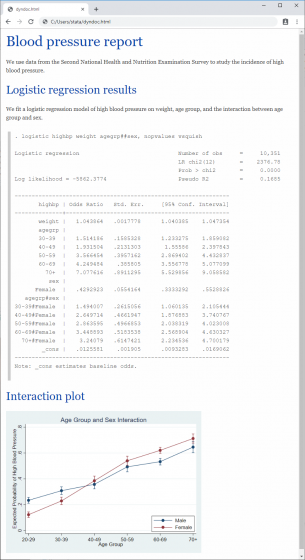
To generate our report in HTML format, we type
. dyndoc dyndoc.txt
This creates the following file, dyndoc.html:
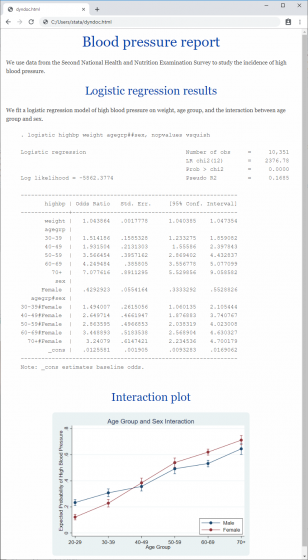
Creating Word documents
We can instead create a Word document from our text file by typing
. dyndoc dyndoc.txt, docx
This creates the following file, dyndoc.docx:
Change the CSS and change the style
Above, dyndoc.html uses a CSS style sheet, stmarkdown.css, to control the look and feel of various HTML elements. This look and feel is also preserved in dyndoc.docx.
We can easily change the style of dyndoc.html–for instance, alignment of headings, code block, and images–by changing stmarkdown.css. After changing stmarkdown.css, simply refresh dyndoc.html in your browser.
To produce the dyndoc.docx with new look, we could run
. dyndoc dyndoc.txt, docx replace
or we could directly convert our HTML file by typing
. html2docx dyndoc.html, replace
To learn more about how to embed Stata output in text, HTML, and Word documents, see [RPT] Dynamic documents intro.
The put* commands
The putdocx, putpdf, and putexcel suites can be used to create customized reports in Word, PDF, and Excel. These commands allow you to format the layout and content of the tables and text being exported.
Let’s begin by creating a Word document.
Creating Word documents
We can create a Word document with the same content as the one we created above by running the commands in the following do-file:
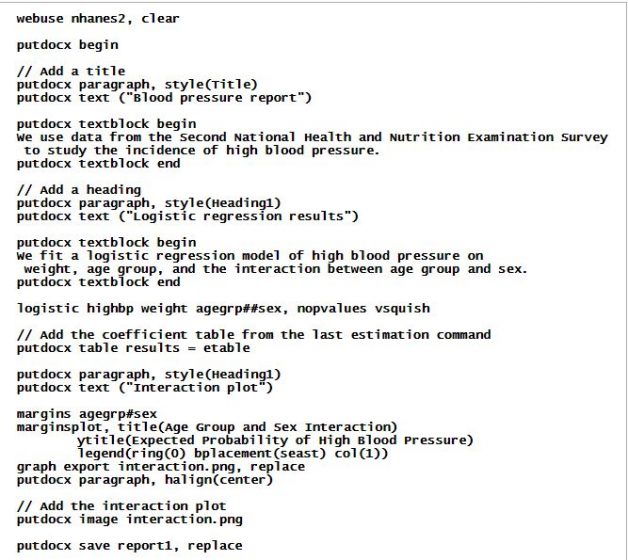
Individual putdocx commands begin the creation of the document, add titles and other text, include estimation results, and add graphs. When we run them, we create report1.docx.

We might want to further customize our document. With additional putdocx commands, we can create a document complete with a header, footer, page numbers, titles, subtitles, and sections with different formatting. Additionally, we can append multiple files and interact Stata’s features with Word’s features.
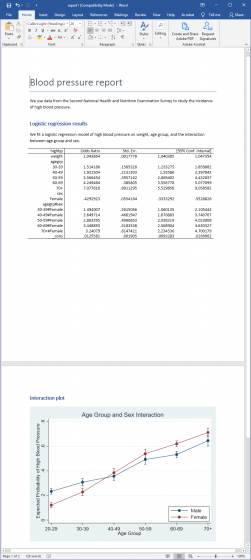
For example, to create a modified version of report1.docx with a header, page numbers, and a formatted table of regression results, we created the following do-file:
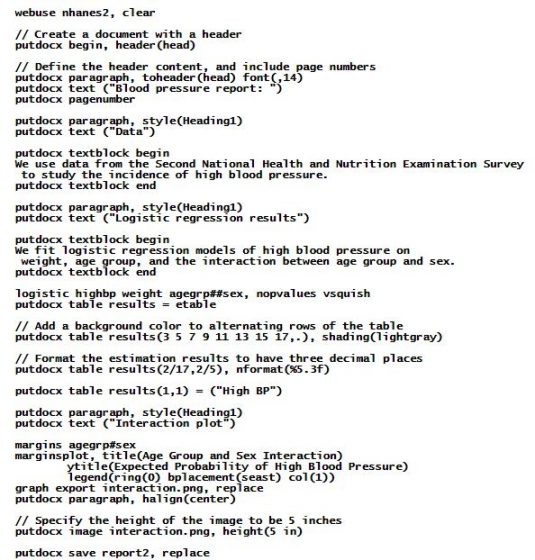
When we run this do-file, we produce the following Word document:
To learn more about creating Word documents with the putdocx suite, see [RPT] putdocx intro.
Creating PDFs
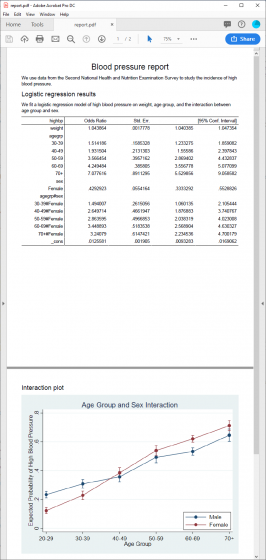
We can create a PDF with the same content as dyndoc.docx. We’ll modify our previous docx1.do file, replacing putdocx with putpdf and making other minor edits:
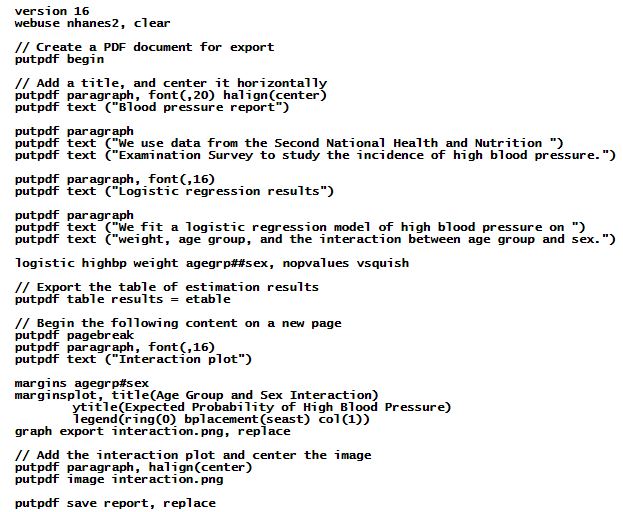
When we execute this do-file, we obtain the following document, report.pdf:
You’ll note that the putpdf commands are very similar to the putdocx commands; the suite includes commands for exporting text, tables, and images.
With the putpdf suite, you can set the page margins for your document and the margin size for any tables you export. Additionally, you can change the graph sizes and divide your document into sections with different layouts.
To learn more about creating reports in PDF format, see [RPT] putpdf intro.
Creating Excel files
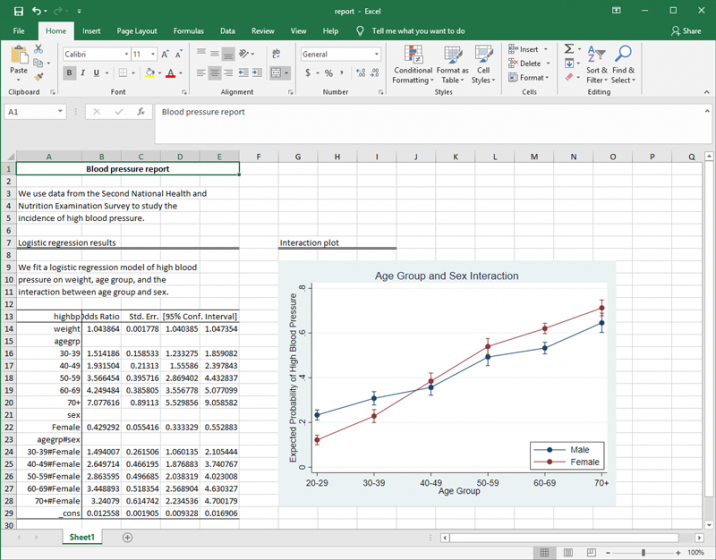
Finally, we demonstrate how to export Stata results and graphs to Excel files. We can use the do-file below to create a version of our blood pressure report in the Excel format:
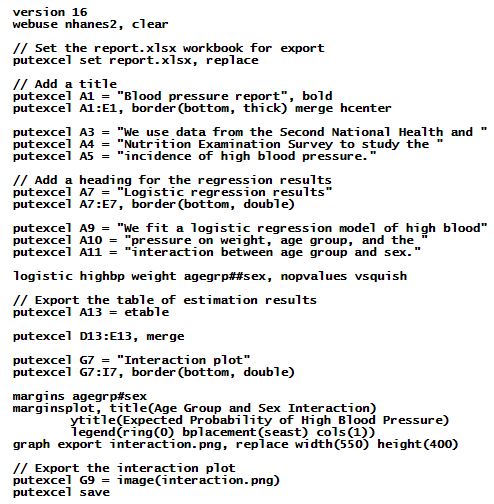
With the putexcel commands, specify the cells in which our text and results should appear. We also add instructions to format table elements such as cell borders.
After executing the do-file shown above, the following Excel file is produced:
We can further customize this document by formatting the statistics, modifying the column labels, changing the alignment of the font, and more. With a few additional putexcel commands, we can customize our final report completely from within Stata.
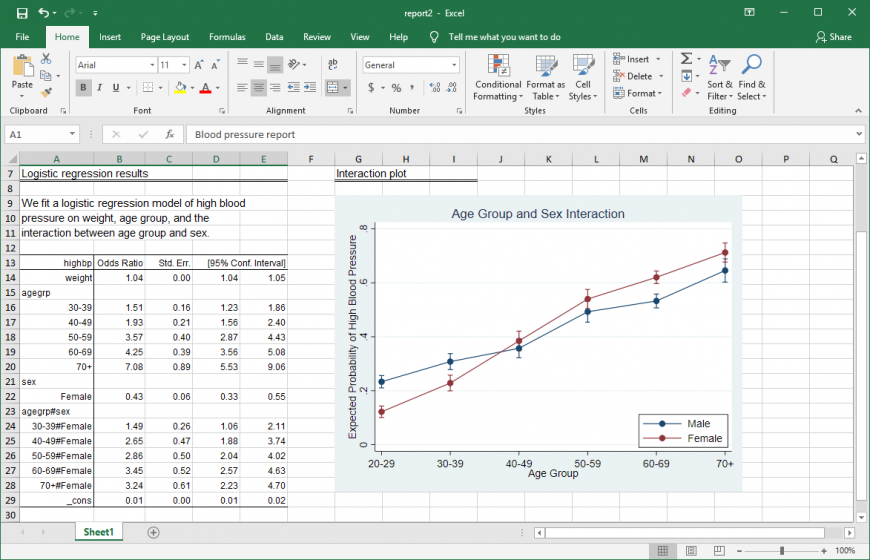
In the do-file shown below, we specify font(“Arial Narrow”, 11) to use a different font type and size, mainly to address the long labels for the interaction terms. We also include the nformat(number_d2) option to format the estimation results to have two decimal places.
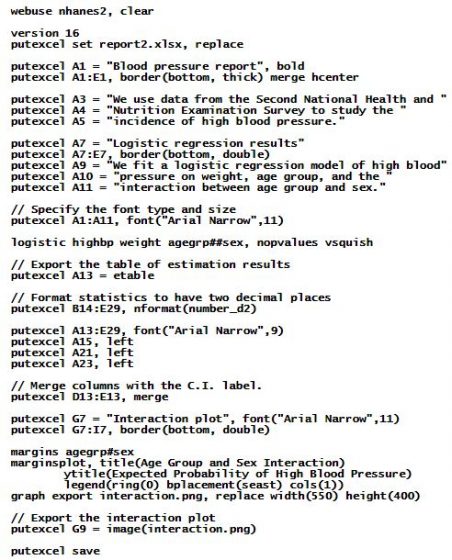
After executing this do-file, we obtain report2.xlsx:
To learn more about exporting Stata results and graphs to an Excel file, see [RPT] putexcel.