OVERVIEW
The Data Editor now has the ability to pin rows and columns. Pinned rows or columns do not scroll with the rest of the data, so they will stay in view as you scroll through the data. This is useful for doing visual comparisons with some other data that might only be visible as you scroll. An ID variable would be a natural thing to pin.
When editing string variables, you may find it convenient to resize the cell editor so that you can see more of the string that you are editing without it scrolling out of view of the cell editor.
You might have a dataset that contains very long strings that, when viewed in the Data Editor, can leave little to no room to see other variables without scrolling them into view. You can resize the variable column widths in the Data Editor to make them narrower, and the column widths are saved with the data. Any cell values that are too wide to fit within its column width are truncated to fit. To see a cell’s value without truncation, hover your cursor over the cell and a tooltip will appear to show you the entire cell value. Very long strings may still be truncated if they don’t fit on the screen, but you will still be able to see more of the cell’s value in the tooltip than you would be able to in the cell’s view.
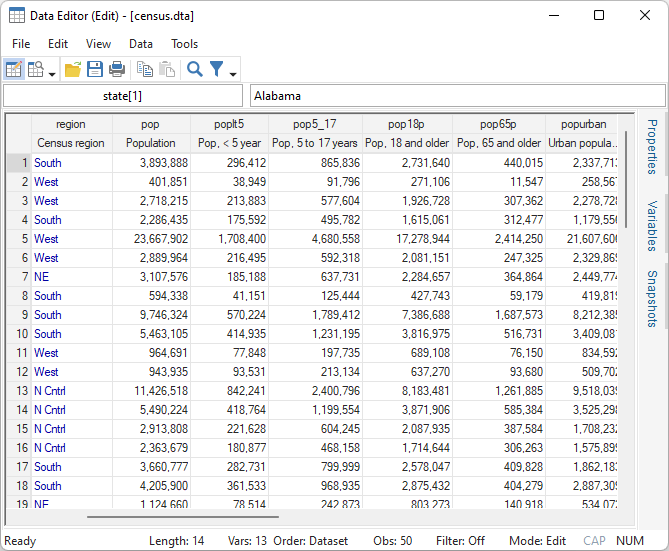
You may have been given a dataset with very short and nondescriptive variable names. If you are lucky enough to have variable labels for those variables or if you have labeled the variables yourself, the variable labels can now be displayed in the column headers right below their variable names. This makes it easy to determine what a variable is without having to look over at the Variables pane to look up the variable’s label. This feature can be enabled in the Preferences dialog for the Data Editor.
The Data Editor now supports proportional-width fonts. This improves readability of the data and allows more variables to be displayed at a time without requiring scrolling. You can still choose a monospaced font if that is the look that you prefer.
DATA EDITOR ENHANCEMENTS IN ACTION!
PINNABLE ROWS AND COLUMNS
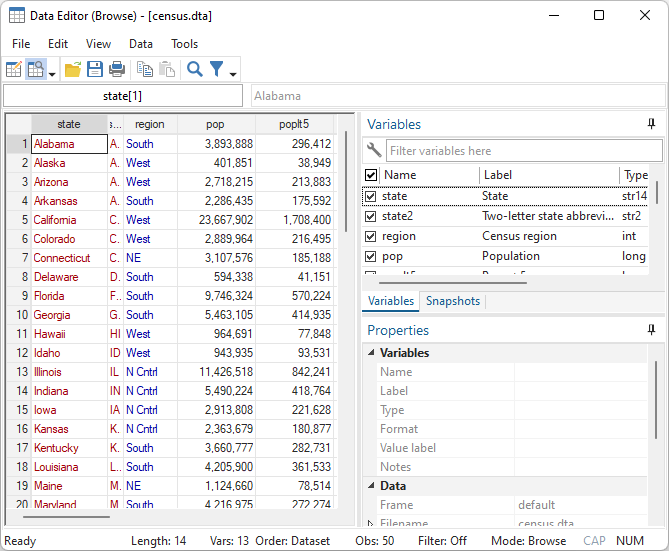
Let’s see pinning rows and columns in action by opening a sample census dataset and starting the Data Editor. This is the 1980 census data by states in the U.S.
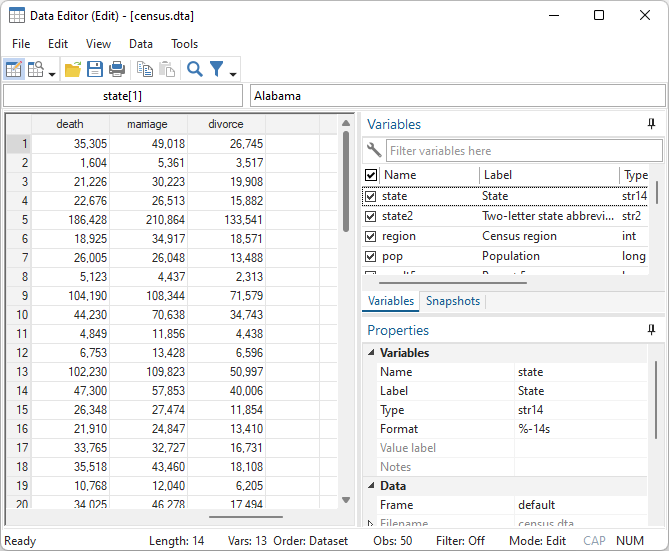
The state variable contains names of the 50 states in the U.S. Because of the limited screen size, we can’t see all the variables within the Data Editor without scrolling. If we scroll horizontally to see more variables such as marriage and divorce, we can’t tell which values belong to which states.
© Copyright 1996–2025 StataCorp LLC. All rights reserved.
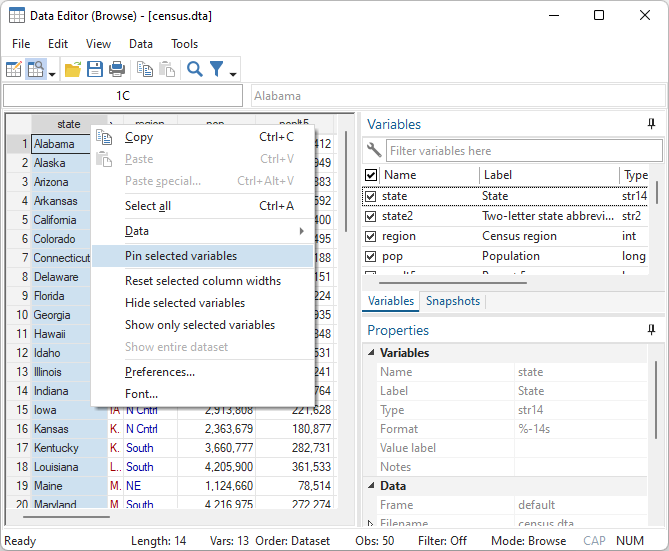
To see the state names next to their corresponding variable values, we want to pin the state variable so that it stays fixed and does not scroll out of view. So we scroll the state variable back into view, click on the column header for the state variable, right-click on the column header, and select Pin selected variables from the contextual menu that appears.
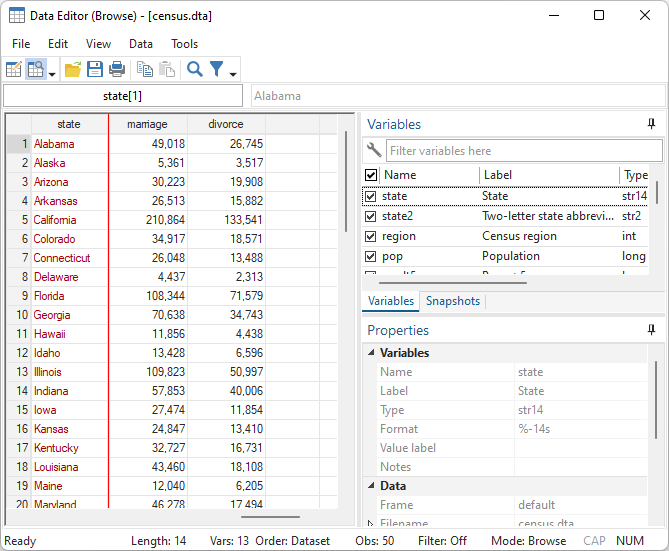
We can now scroll horizontally to the right and and bring the values for the variables marriage and divorce into view, right next to their corresponding state names.
DISPLAY VARIABLE LABELS IN COLUMN HEADERS
In viewing the sample census dataset, it is not obvious from some of the variable names what values they contain. We can look at the Variables pane for each variable and the see the variable label for each variable. Or we can check the View > Show variable labels in column headers menu item to display the variable labels in the column headers and easily identify them that way. You can permanently show the variable labels in the column headers by setting the preference in the Data Editor’s Preference dialog.

