AN OBJECT-BASED INTERFACE
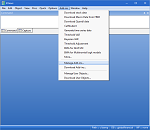
At the heart of the innovative EViews interface is the concept of an object. Series, equations, and systems are just a few examples of objects. Each object has its own window, menus, procedures, and its own views of its data. Most statistical procedures are simply alternate views of the object. For example, a simple menu choice from a series window changes the display between a spreadsheet, various graph views, descriptive statistics and tests, tabulations, correlograms, unit root, and independence tests.
Similarly, an equation window allows you to switch between a display of the equation specification, basic estimation results, actual-fitted-residual graphs and tables, a display of the equation ARMA structure (if appropriate), gradients and derivatives of the specification, the coefficient covariance matrix, forecast graphs and evaluations, and over a dozen diagnostic and hypothesis tests.
MULTIPLE WINDOW DISPLAY
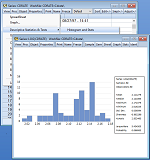
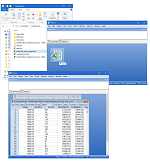
Unlike traditional statistics programs that support viewing only one estimation equation or graph at a time, EViews allows for simultaneous display of multiple objects, each in its own window. This true multiple window support makes it easy to perform side-by-side comparisons of series plots, hypothesis tests, equation estimates, or model forecasts developed under alternative assumptions.
DYNAMIC OBJECT UPDATING
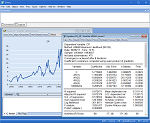
EViews incorporates the best of modern spreadsheet and relational database technology into tools for performing the traditional tasks of statistical software. The EViews object-based approach includes sophisticated linking technology that allows you to define relationships between multiple objects and external data sources. Series objects, for example, may be linked by formula to data in other series, to match merged or frequency converted data from alternate data sets, or to data from external databases. When defined in this fashion, the linked series dynamically updates its data whenever the underlying data change.
© 2024 S&P Global
Similarly, an EViews model simulation object can be linked to equation or system objects so that the model specification updates automatically when the underlying equation or system is re-specified or re-estimated.
WINDOWS INTEGRATION
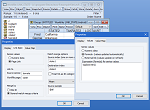
Couple all of this with strong Windows integration, including drag-and-drop file import for over twenty popular file formats and copy-and-paste export of presentation quality graphs and tables, and you have a modern interface that allows you to accomplish, with ease, tasks that are difficult or impossible using traditional statistical software.
ADD-INS AND USER OBJECTS
EViews offers an easy-to-use EViews Add-ins infrastructure that provides seamless access to user-defined programs using the standard EViews command, menu, and object interface.
Add-ins offer you a exciting new way of running EViews programs. You may readily define Add-ins that augment the EViews language with user-defined commands, specify new menu entries for point-and-click program interaction, and display program output in standard EViews object windows.
User objects further extend EViews by allowing the creation of user-defined objects inside your workfiles. User objects can be as simple as a basic results storage containier to as complicated as a fully functioning estimation object.
All EViews users may benefit immediately by installing prepackaged Add-ins which add functionality to EViews. A single click is all that you need to download and install any of the Add-ins currently available on the TStat website, with the promise of more to come.
