| |
GAUSSplotTM
Professional Graphics
GAUSSplot Professional
Graphics are now available!
GAUSSplot features a fully functional GUI that
allows you to make
changes to your graph at the click of a
button. Take your graphics in
GAUSS to the next level with GAUSSplot!
GAUSSplot professional level graphics take
your graphics in GAUSS to a
whole new level! GAUSSplot features a fully
functional GUI that allows
you to make changes to your graphs with the
click of a button.
GAUSSplot supports a wide variety of plot
types, including XY line
plots, bar plots, polar line plots, 2D
Cartesian plots, 2D contour
plots, 3D Cartesian plots (with the ability to
graph 3D surfaces and
solids, Gouraud shading, configurable light
source intensity and
location, and surface translucency), and 3D
contour plots. In addition,
GAUSSplot supports built-in curve-fitting, 3D
rotation and animation. A
wide variety of file export types are
supported, including EPS,
PostScript, HPGL and HPGL/2, WMF, JPEG, BMP,
PNG, TIFF, PostScript
bitmap, Sun Raster bitmap, and X-Windows
bitmap.
GAUSSplot is enhanced with visualization
software from TECPLOT, Inc., one of the
premier creators of graphic software.
GAUSS, GAUSS Engine, GAUSS Light, and
GAUSSplot are trademarks of
Aptech Systems, Inc. Copyright 1983-2007.
TECPLOT is a registered
trademark of Tecplot, Inc., Bellevue,
Washington, US. Copyright 2004.
New in
GAUSSplot 8.0:
New graphs include:
- histogramsfrequency histogramspercentage
histograms
- Box graphs using the percentile method
The XY Line
graphs have been expanded to include:
- Graphs with Log scaling for the X
axisGraphs with Log scaling for the Y axis
- Graphs with Log scaling for the X and Y
axes
Nearly 50 new
functions added
Below are some
examples
of the kinds of graphics you can create in
GAUSS with GAUSSplot,
including some of the new plots available in
GAUSSplot 8.0.
Loglog
Plot
Bar Plot
Log
Plot
3D Contour Plot
3D Cartesian Plot 1
2D
Contour Plot
3D Cartesian Plot
2
3D Contour Plot 2

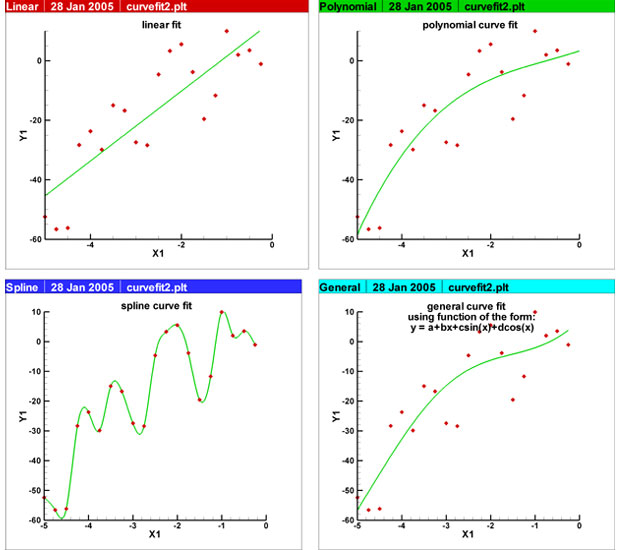
XY Line Plot (Curve Fits)
GAUSSplot supports a wide variety of plot
types, including XY line
plots, bar plots, polar line plots, 2D
Cartesian plots, 2D contour
plots, 3D Cartesian plots (with the ability to
graph 3D surfaces and
and solids, Gouraud shading, configurable
light source intensity and
location, and surface translucency), and 3D
contour plots. In addition,
GAUSSplot supports built-in curve-fitting, 3D
rotation and animation. A
wide variety of file export types are
supported, including EPS,
PostScript, HPGL and HPGL/2, WMF, JPEG, BMP,
PNG, TIFF, PostScript
bitmap, Sun Raster bitmap, and X-Windows
bitmap.
GAUSSplot is enhanced with visualization
software from TECPLOT, Inc., one of the
premier creators of graphic software.
© Copyright 2015 Aptech
Systems, Inc.

|
|


